1. Launch and Create
Launch JMeter, choose Recording Template and click the Create button.

2. Setup Port and Capture Recording Log
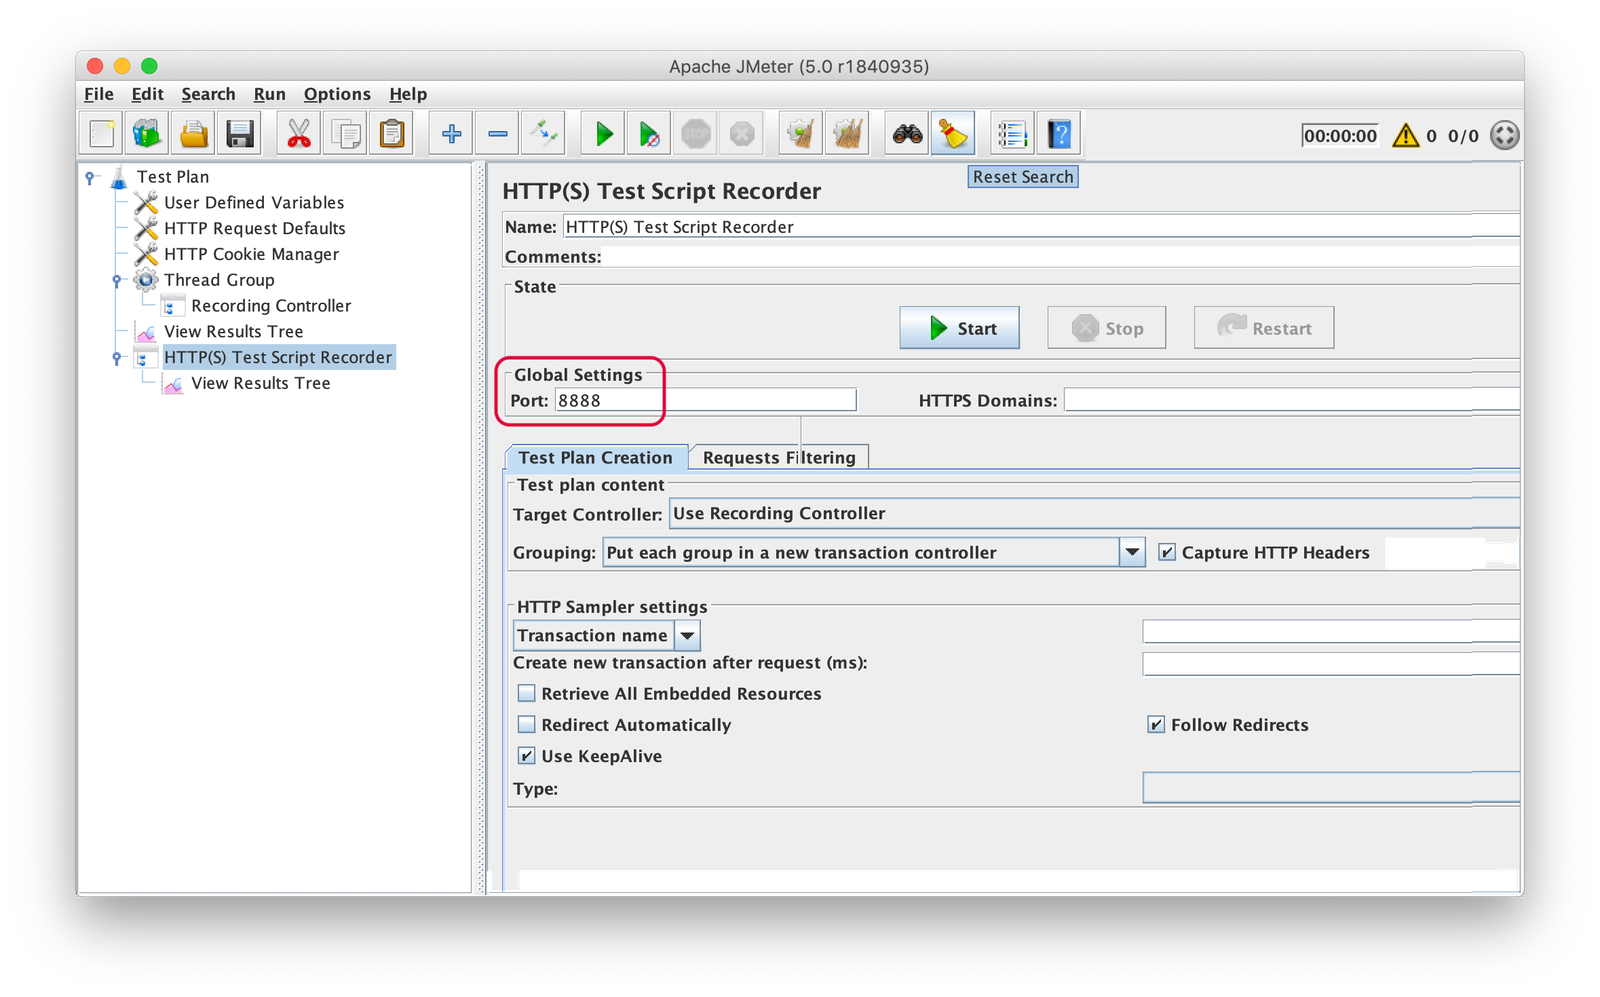
In HTTP(S) Test Script Recorder setup Port 8888 and in the corresponding View Results Tree element, enter the filename to capture Recording Log.


3. Configure LAN Settings
Configure Address: localhost & Port: 8888 under LAN settings in Internet Options.

4. Record Application Traffic
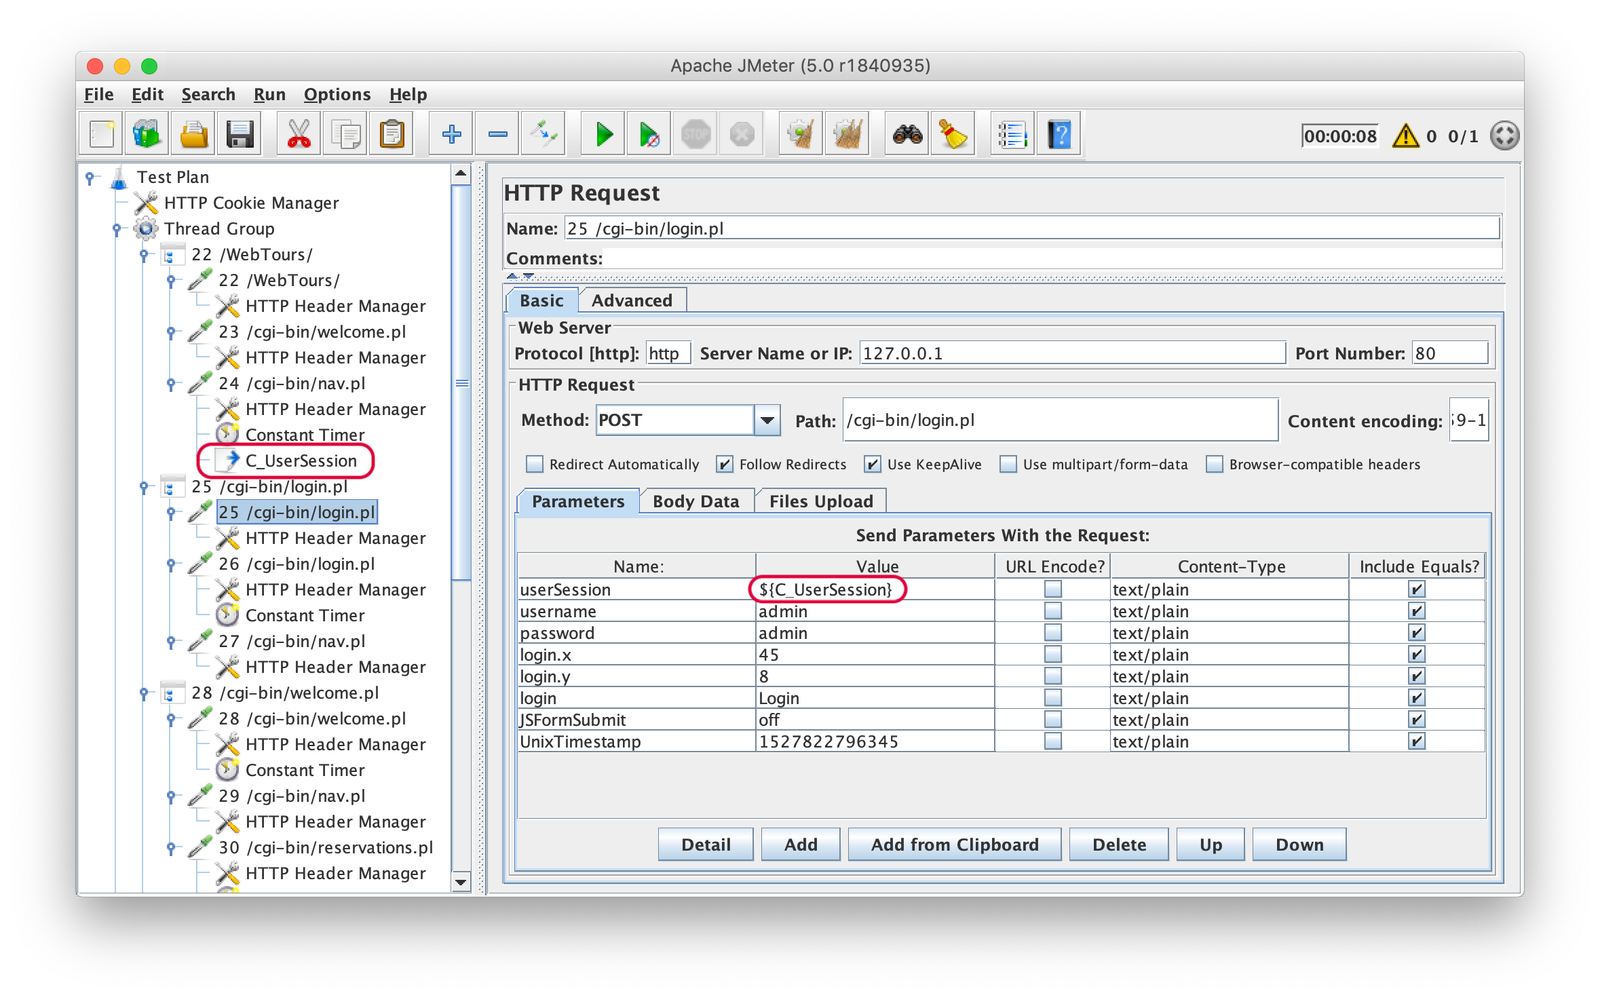
Open your application in Internet Explorer or Chrome & navigate through a business flow. After recording, your script will look like in the screenshot here.

5. Auto-Correlate using JCorrelate
Auto-Correlate the JMeter Script using JCorrelate. After auto-correlation, most of your dymanic parameters would have been correlated and your script will look like the below. Please click here if you want to watch our tutorial on how to use JCorrelate.

6. Enhance using JBasic
Enhance the JMeter Script using JBasic. After enhancement, your script will look like the below. Please click here if you want to watch our tutorial on how to use JCorrelate.

7. Determine VUsers using JCalculus
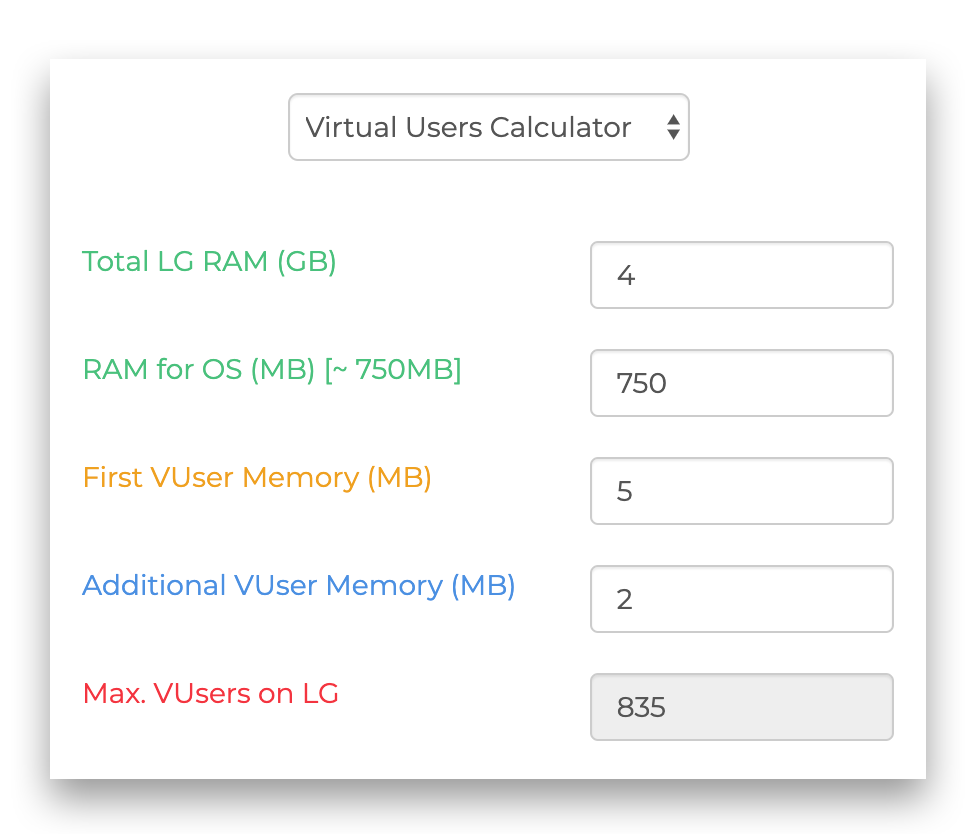
Derive ThinkTime and the Maximum No of VUsers that can run on your machine using JCalculus.
Example: If you machine has 4 GB RAM and if your OS consumes approximately 750 MB for it processes, you will be able to run approximately 120 users on your machine (considering First VUser Memory as 5 MB & Additional VUser Memory as 2 MB).
Example: Lets consider that you need to achieve 5 TPS & the Average Response Time of your application is 2 Secs. Your Think Time would be 22 Secs.


8. Configure Thread Group and Listeners
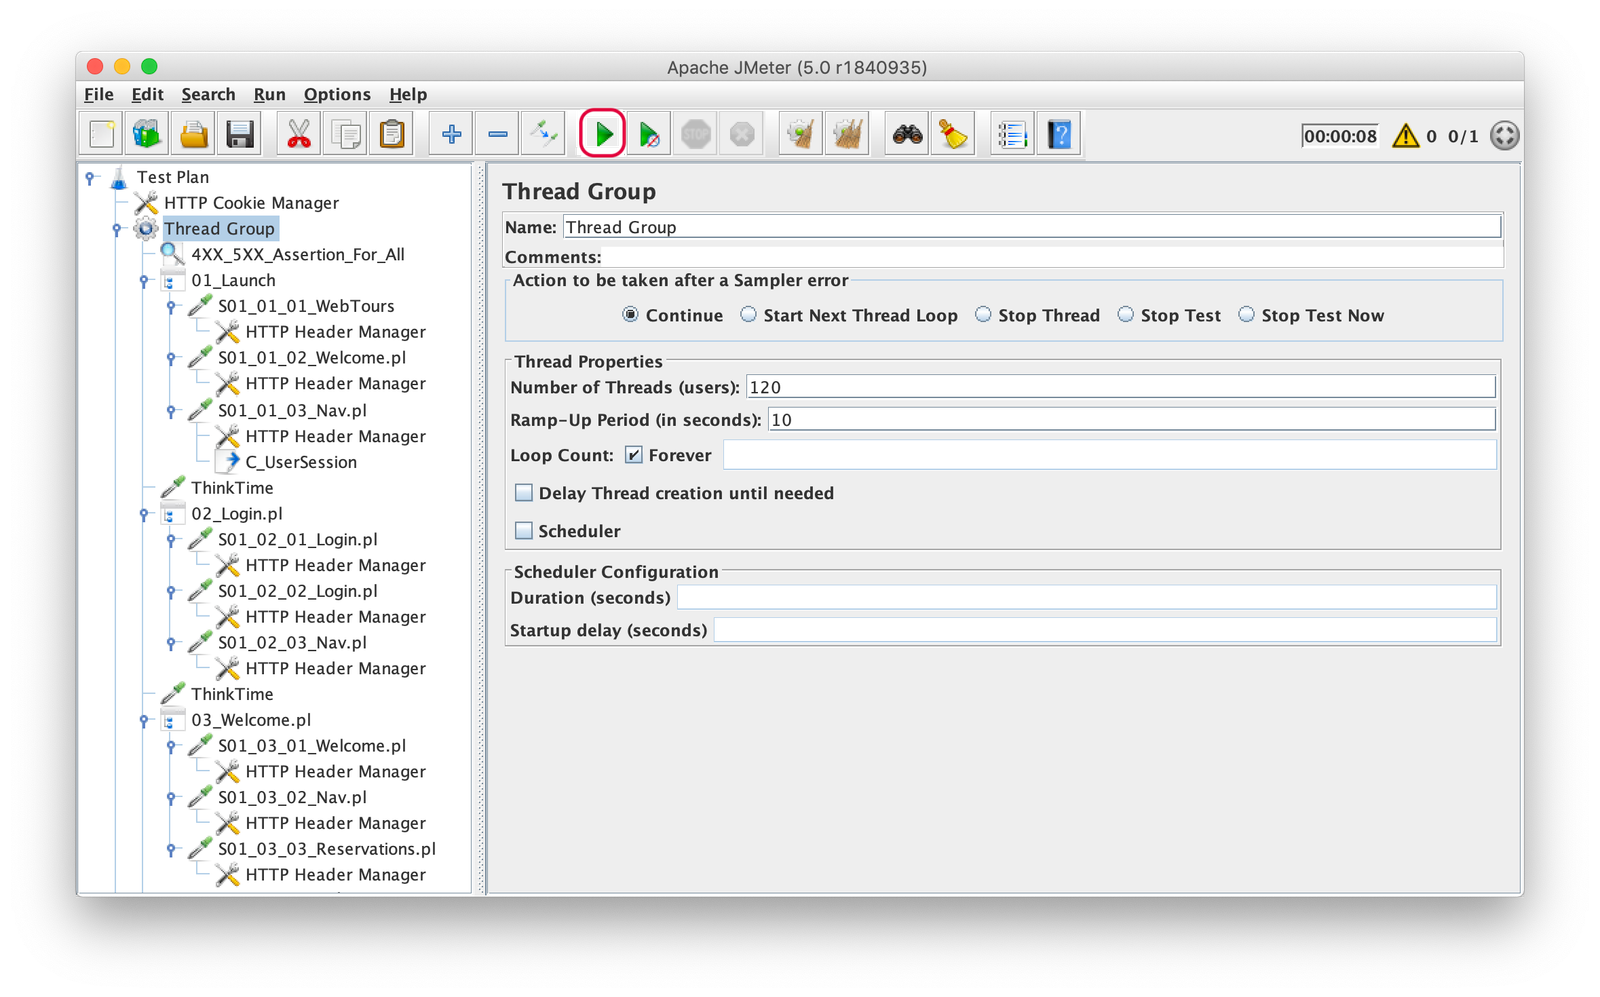
In the Thread Group options, Enter the Number of Threads (users) as 120. Enter Ramp-Up period (in seconds) & Loop Count. We have considered 10 Secs Ramp-Up and Forever looping.

9. Run Performance Test
Click Run or press F5 to run a performance test locally on you machine and monitor the results via Listeners. If you want to run a performance test with more number of Vusers, you need to run the performance test in Distributed Mode by configuring Master and Slaves.

